 Skip to content
Student Profile
Student Profile Overview
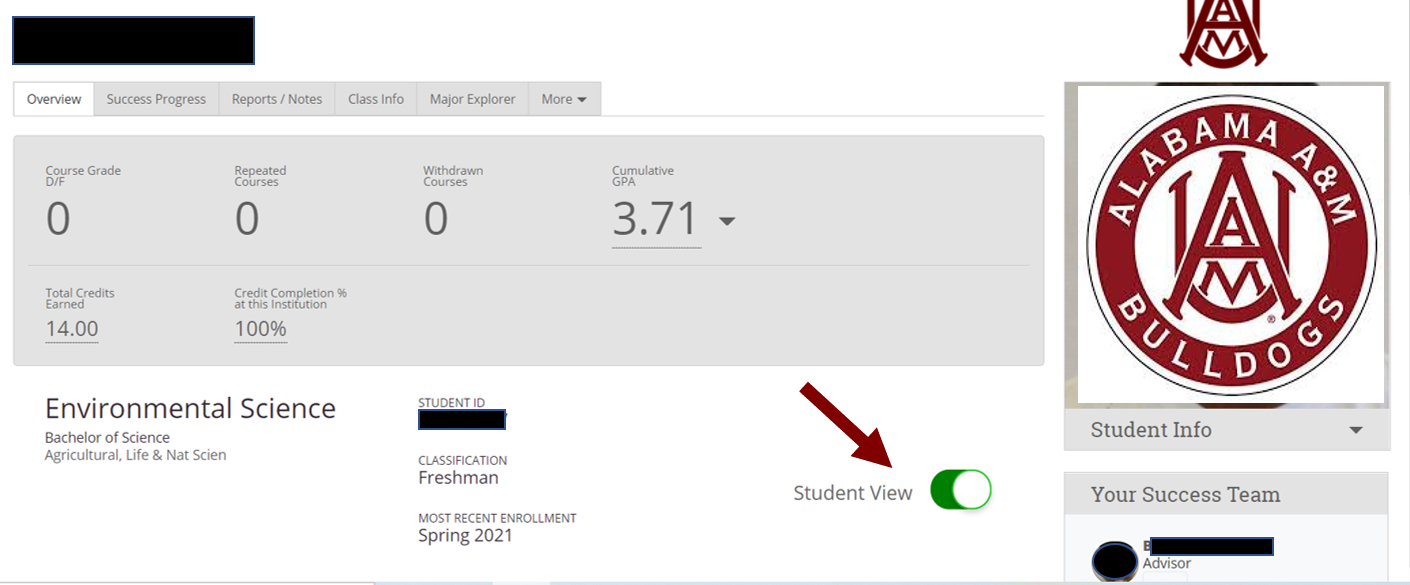
To view a student's profile, simply click the students name via the link anywhere in Bulldog Navigate. The student overview will be the first tab displayed.
Important! Change to Student View if you are sharing your screen and viewing with a student so student does not see Risk Indicator.
Student profiles are at the center of the advising application. However, to understand the importance of what the student profile can do, some background understanding is required which is covered in this overview. The student profile is a set of information about the student and their academic performance. The profile contains information centered on proactively identifying students at risk of not graduating in their major and providing the tools to support the student.
Academic Summary
The Academic Summary shows the student's major and division, number of Ds and Fs the student has received, number of repeated courses and withdrawals, the risk indicator for the student for his or her major, and most recent term of enrollment.
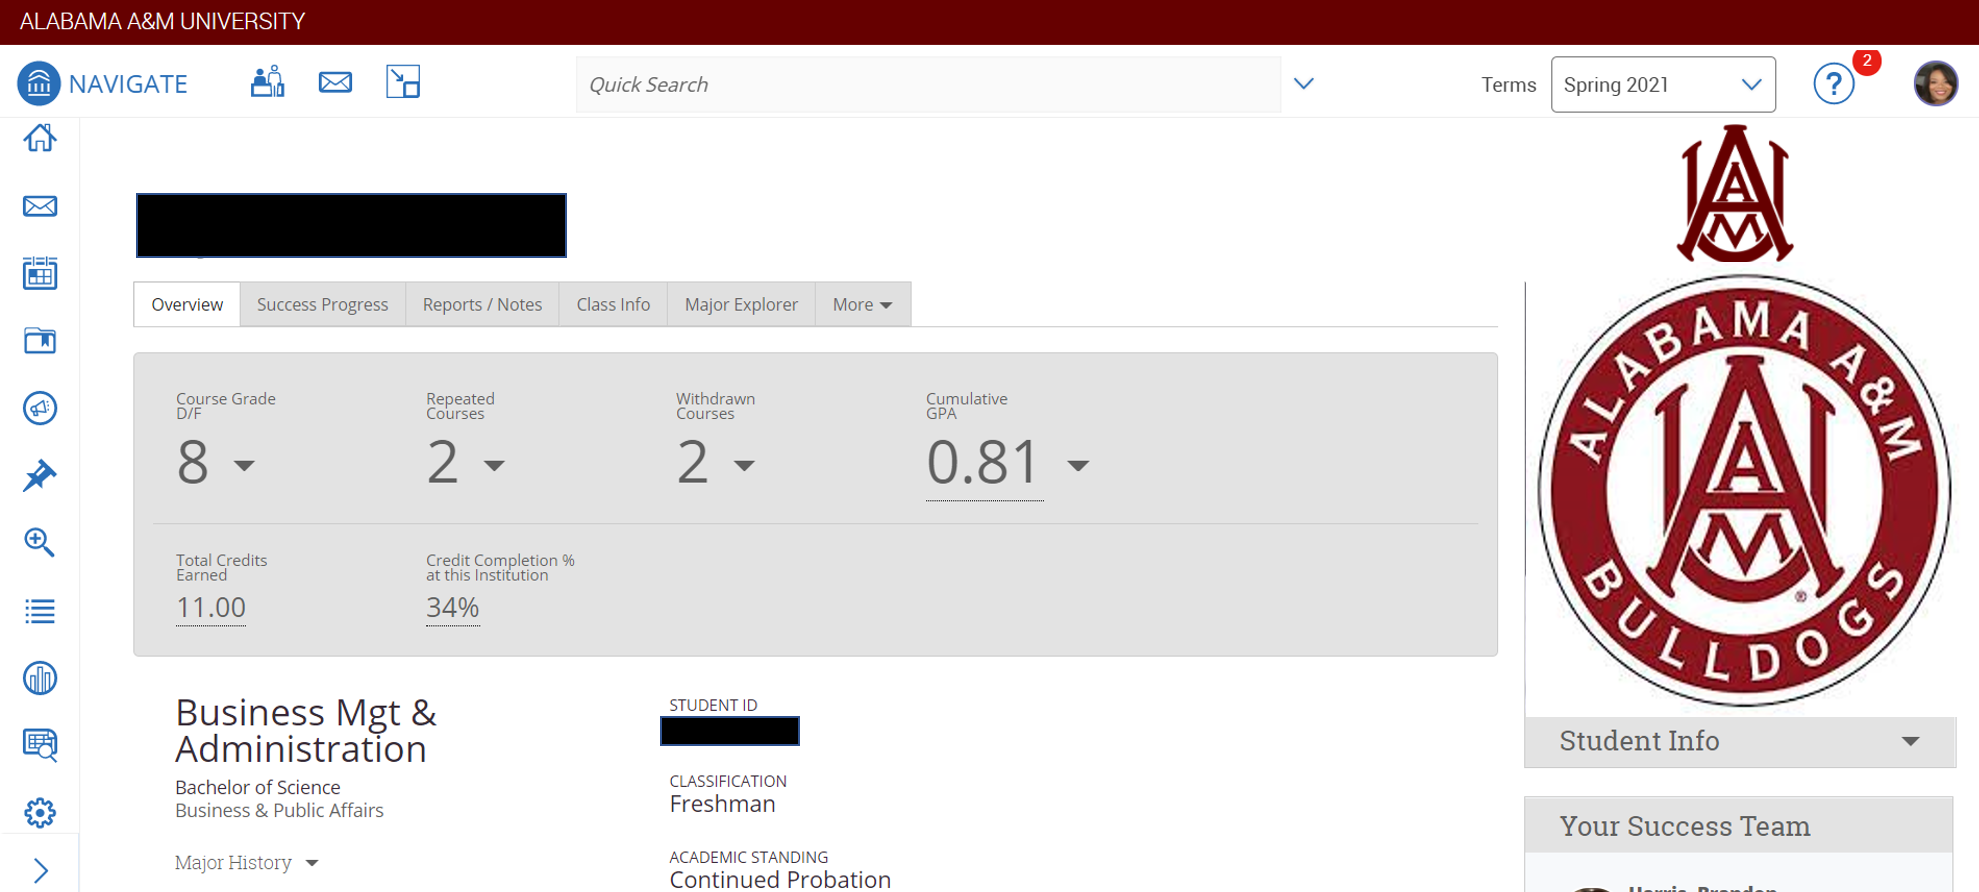
Users can also see the student's major, GPA, total credits, institution completion ratio (earned credits divided by attempted credits), missed number of success markers, number of staff alerts categories/tags), staff working with the student, and if the student has received any support on campus. By rolling over underlined information, users will get more detailed information.
Risk
The EAB Bulldog Navigate data platform predicts individual students' likelihood to graduate in a wide range of majors on each campus. Data on historical student cohorts is collected to generate an initial series of candidate academic metrics. Advanced multivariate statistical and machine learning techniques perform variable selection and conduct hypothesis testing to highlight the most impactful trends in student data. Results are cross-validated for accuracy and compared with known research on student success outcomes. This process may be referred to as "model training."
Success Progress
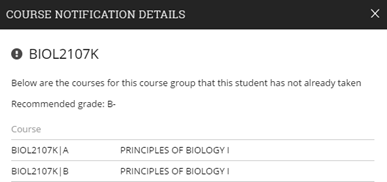
Clicking on the notifications number will take the user to the Success Progress page, where they will see details about the notifications. Success Progress shows the student's academic summary as well as success markers and the student’s performance against the success markers. Success markers are a course or group of required courses key to student success within a major, frequently first and second year courses, which are entered into site so that advisors can identify and intervene with students who not completing the markers. These are based on the timeframe (credit accumulation) by which students must complete the course and the recommended grade threshold that students should achieve.
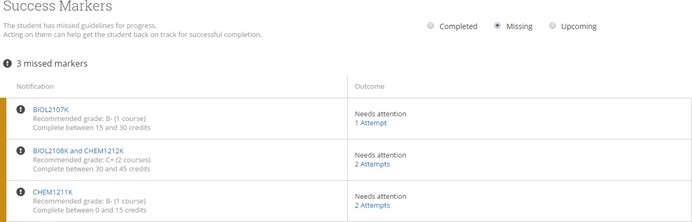
Users can learn more about success marker details by clicking any requirement that is blue. They can also look at completed, current, or upcoming notifications by selecting the appropriate button.
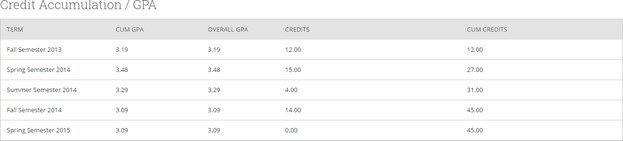
The Student Progress section also shows the student’s GPA trend and credit accumulation, two factors used by the predictive model to determine student risk level. Users can view GPA term by term, at the institution, or overall (e.g. the combination of cumulative and transfer GPA). If your institution does not provide term and institution GPA, you will only see cumulative GPA. Likewise, users can view credit accumulation by term or cumulative credits accumulated, further broken out by credits attempted and credits completed when applicable.
Class Info
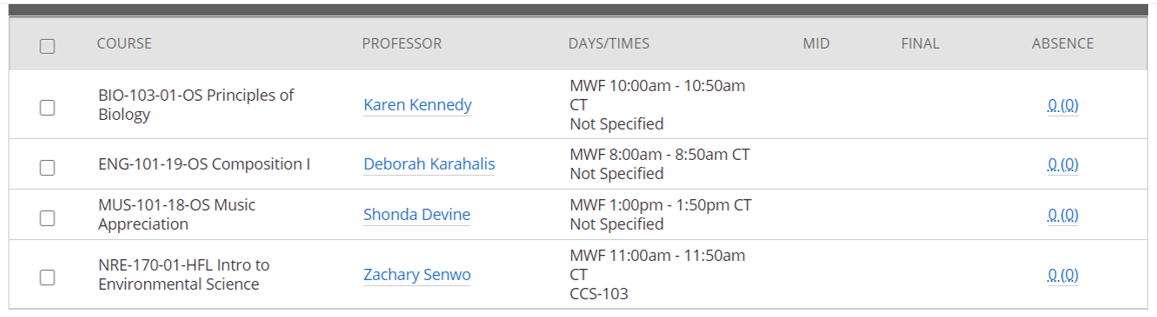
The first grid displays the student’s schedule for the current term. Alongside each course name will be a professor’s name. You can click on the professor’s name to view their profile. You will also see the days and times each class meets, along with any mid-term or final grades assigned. It’s important to note that the mid-term and final grades come from your Student Information System (Banner) not from a professor’s grade submission.
Transcript
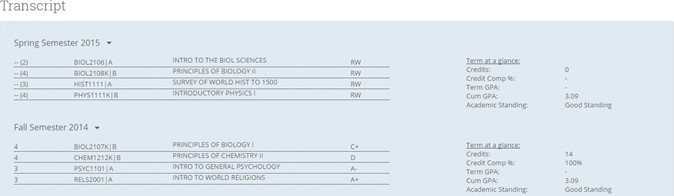
The Transcript provides a term-by-term view of the student’s academic record, together with important metrics like term GPA and completion ratio. Pre-enrollment data like ACT and SAT scores, and High School GPA, if provided during the Admissions process, will appear in the student’s first term. The amount and type of pre-enrollment data may vary depending on what is available for a particular student, but will generally include standardized test scores, high school name, and high school GPA.
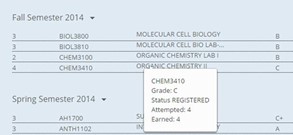
Advisors can get more details about a course by rolling over the course title.
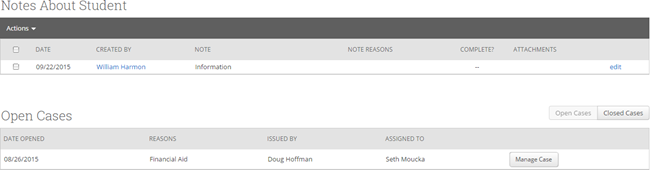
Reports/Notes
Perhaps one of the most informational tabs on the student’s profile is the Reports/Notes tab. It contains information on Cases, Alerts, Progress Reports, and Notes. When a student is marked at-risk, a Case (or “case file”) can be opened in order to follow up with that at-risk student. A case lets advisors record what actions transpired to help the at- risk student. This grid will display all cases that have been opened for that student and the Manage Case button will let the advisor add an activity to the case.
Major Explorer
The Major Explorer uses the advising application’s predictive analytics model to guide student and user decisions about major decisions. Because many users and students will be curious about how Major Explorer does this, we have included a brief explanation of how predictive modeling works in this case.
The Major Explorer uses a predictive algorithm to generate information about whether a course of study is a good fit for the student, attempting to find the majors where the student has the highest chance of graduating. To do this, the algorithm analyzes basic data from the student information system. Items like GPA and credit accumulation start to determine the degree to which a student is at risk. Additionally, student coursework is analyzed to determine the level of skill a student has demonstrated in a content domain such as the humanities, STEM courses such as biology and mathematics, business and economics, et cetera. The student’s skills are matched to their current major. Risk is mitigated when their skill strengths create a high match with the skills needed to excel in the major.
Finally, Major Explorer generates a high/moderate/low risk level that estimates how likely the student is to complete the major. Red suggests that without intervention, the student will have the most challenge in completing the major. Yellow suggests the student is statistically more likely to complete these majors, but there is more challenge for the student than a major with a green indicator. Green indicates majors the student will have the least challenge completing overall.
Recommended majors are shown in order beginning with the best match according to risk. Students who are at moderate or high risk in one major may not have a low-risk match because the factors determining their risk (GPA, credit accumulation, etc.) are applicable to all majors. Major Explorer provides other options to guide a student toward a major, including filtering by majors available in a college or searching directly for a major or career. Clicking on a major name will take the user to a page that describes the major and shows careers related to the major.
Additionally, users may search for majors not shown on the page for the student to investigate. The student’s current major will be listed first for comparative reasons. Major Explorer displays the risk color associated with the student’s likelihood to graduate in the major for each major on the page.
The career information is provided by Burning Glass, a leading career information provider and Student Success Collaborative partner. Users can also use the search box to search for related careers as well as majors to compare. Clicking on a related career will share more information about the career and national hiring statistics.

Skills Analysis
The Risk Score Analysis shows the risk areas and how the student compares to students who successfully completed the major. Looking at risk area performance will also indicate why the student is or is not at high risk of not completing the major. The first skill area usually rises to the top because the student’s performance has a high importance to major completion and the student’s comparative performance is below average compared to the historical norm. In addition, the risk score analysis will make suggestions about what the student can do to improve chances of succeeding in each risk area.